Livestock Feedlot Data Management
Transforming a failing enterprise platform into a role-based system before $2M+ in clients walked
ROLE
Fractional Lead Product Designer
TIMELINE
4 months
TEAM
PhD Veterinary Consultant/PM, CTO, 4 Engineers, Subject-matter experts
Saved in client contracts
Of pilot clients converted to paid contracts
Faster daily monitoring (2hrs → 15min)
Users who customized their dashboard in week 1
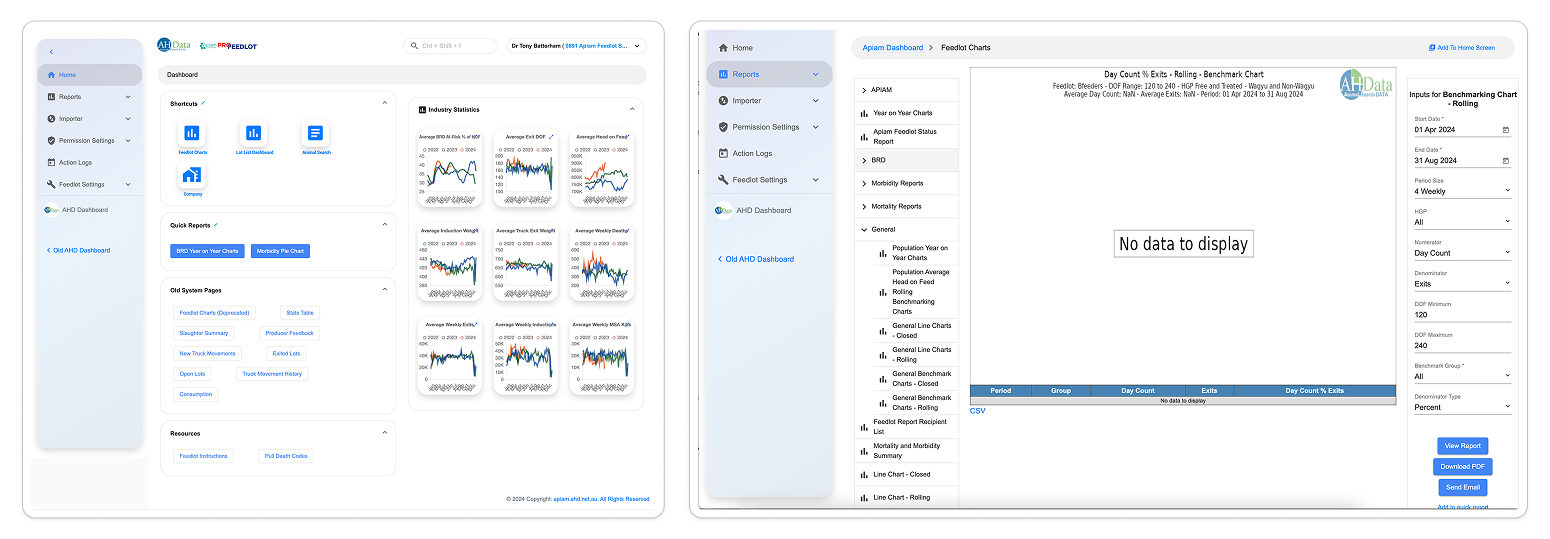
Replacing a Failing Platform
Ausvet is a recognized leader in veterinary epidemiology and animal health data systems. Their platform, Animal Health Data (AHD), was essential for livestock feedlots to track health and production. But AHD was failing. It was slow, difficult to use, and could not keep up with client needs. Long-term clients worth over $2M annually were walking.
Ausvet decided to rebuild. The initial plan was to work from a long list of feature requests collected over years. This risked repeating past mistakes by focusing on features instead of user needs.
I pushed back. Working from a feature list would build the wrong thing faster. I asked for two weeks to run research, then we'd build from a real strategy instead of a wish list. They agreed.
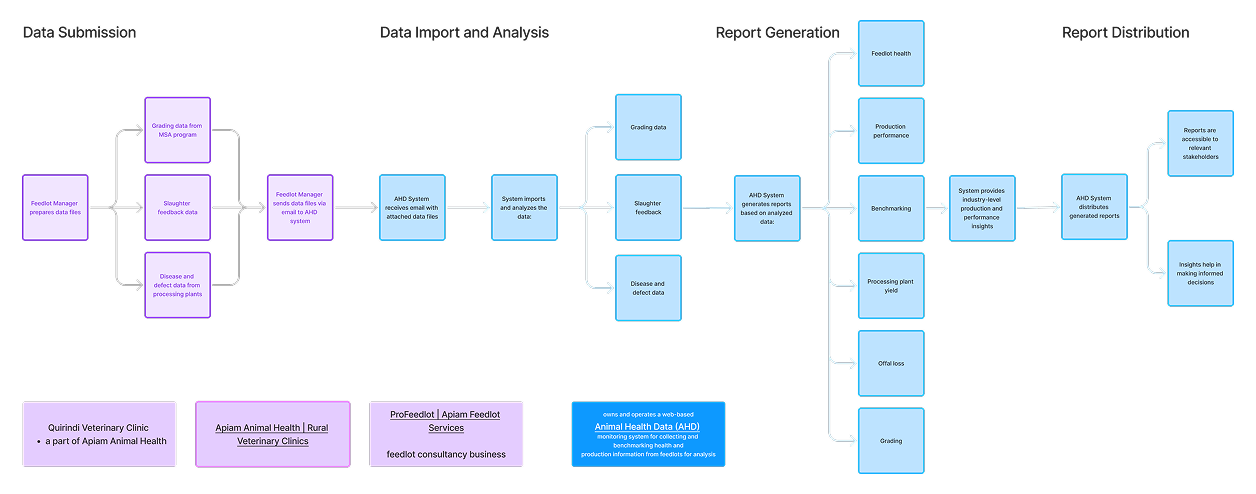
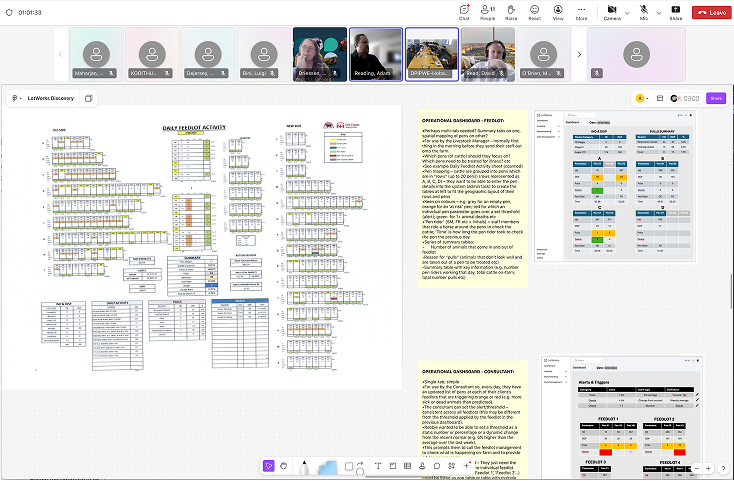
Discovering the Real Problem
Facing a tight deadline and no prior research, I focused on understanding the people and their workflows. In two weeks, I ran system mapping and stakeholder interviews in parallel. AI tools helped process complex spreadsheets, transcribe interviews, and surface patterns across operational documents.
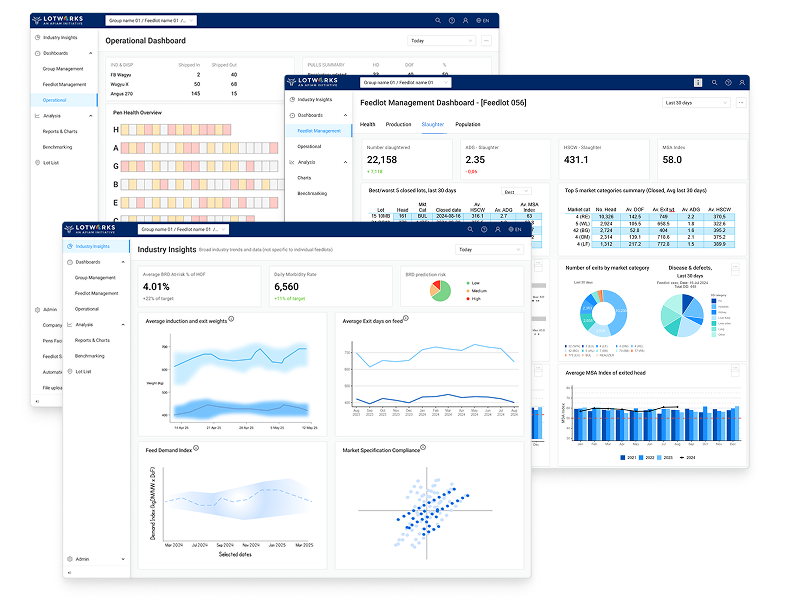
This process transformed the vague "user" from the feature list into 4 distinct personas, each with a completely different job:
- The Livestock Manager needs to know which pens need attention right now.
- The Veterinary Consultant spots outbreaks before they happen across multiple feedlots.
- The Feedlot Analyst plans for next quarter and benchmarks against the industry.
- The Administrator keeps data flowing smoothly.
The research showed that one-size-fits-all doesn't work when jobs are this different. A consultant monitoring 12 feedlots needs a completely different view than a manager walking pens at 6am.
I reframed the solution from "upgrade the existing platform" to "build role-based dashboards that serve fundamentally different workflows."
Validating the Structure
I tested the proposed structure with clickable, grey-box prototypes. The veterinary consultant helped recruit users and run sessions. Key findings included managers thinking in maps not spreadsheets, consultants needing "quiet" alerts that only surfaced when necessary, and terminology being critical to building trust.
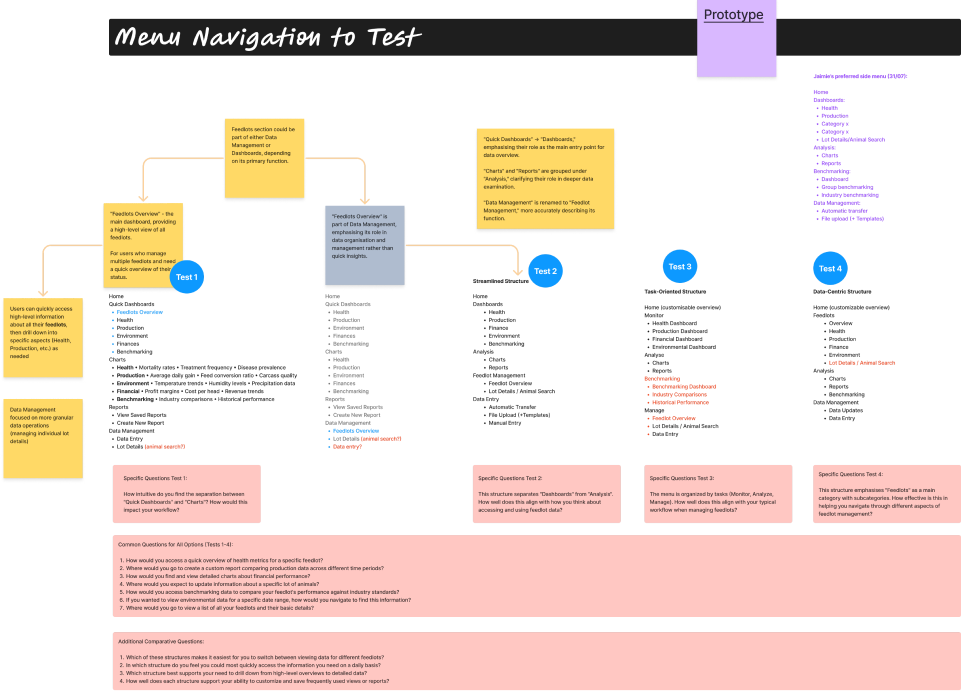
The validation confirmed the direction but revealed something important. Users needed flexibility, not just better defaults. The solution was starting each role with an expert-curated view, then letting them customize freely.
92% of users customized their dashboard in the first week, proving they understood the system well enough to make it their own.
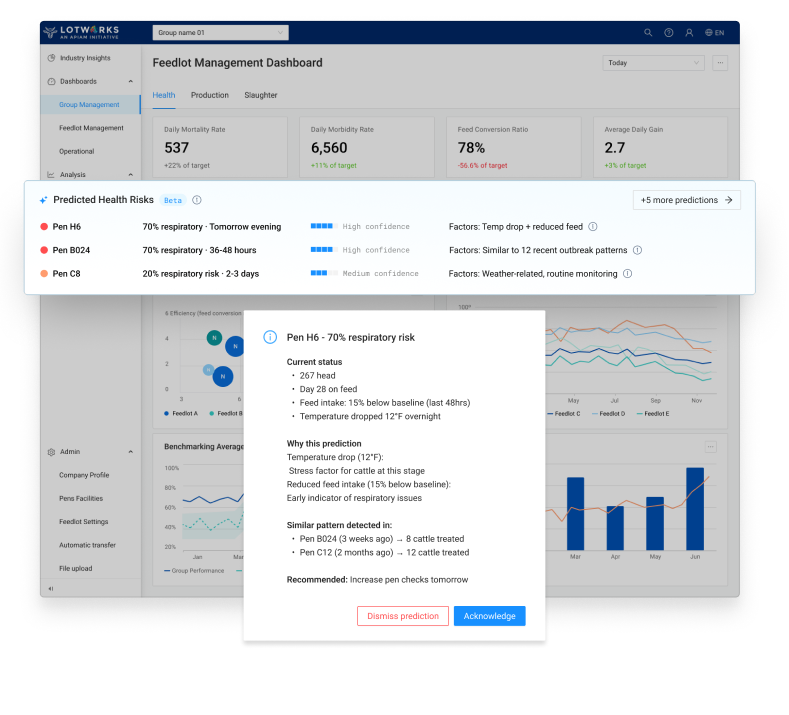
Designing for AI-Powered Predictions
The Manager dashboard includes AI predictions. Unlike traditional analytics showing what happened, this predicts what might happen, requiring users to trust and act on uncertain information.
I made the AI's reasoning visible, not hidden. Each prediction shows current metrics, contributing factors, and similar historical cases. The AI provides a confidence level for each prediction, and users can set their own alert threshold, choosing to see only high-confidence predictions or surfacing earlier warnings.
Managers can dismiss predictions that don't match field observations.
This approach turned AI into a decision aid, not a black box. Managers get early warnings while staying in control.
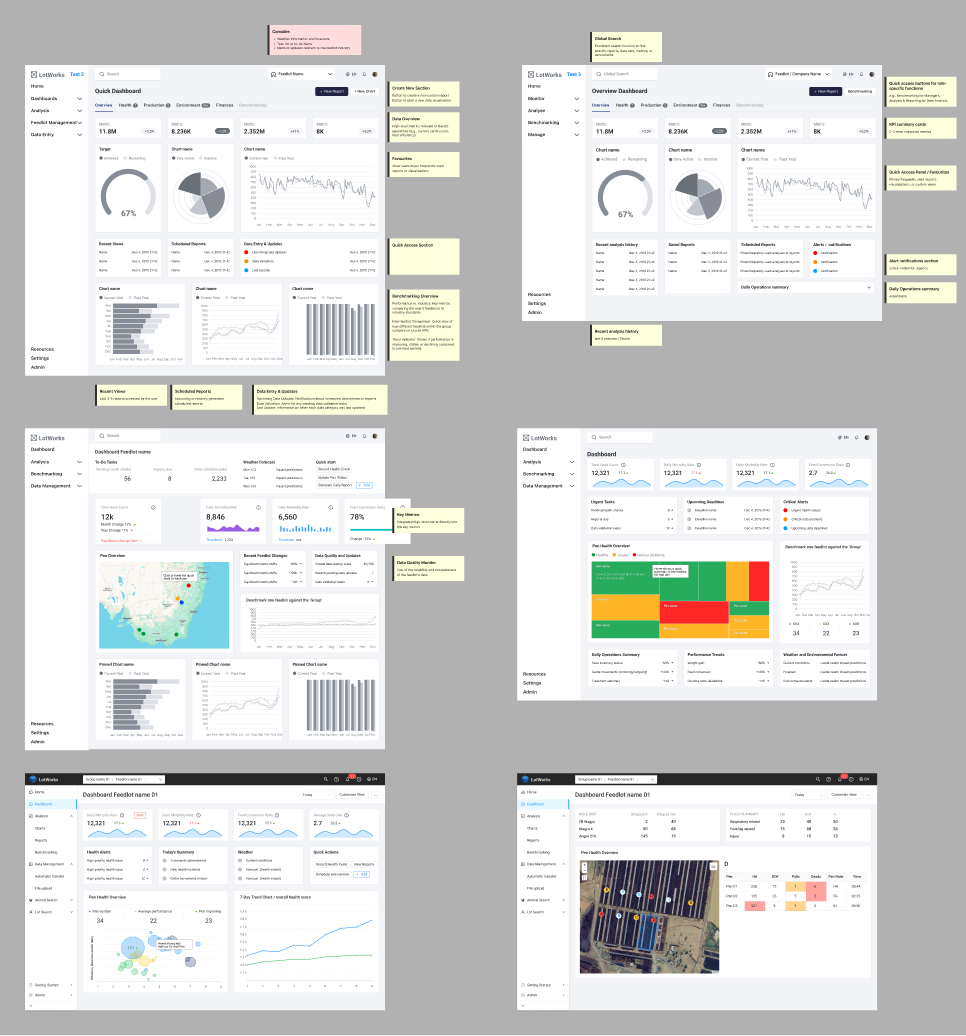
Building Under Pressure
The business needed a working platform in six months to retain major clients. We had just eleven weeks to design four distinct user experiences.
My strategy was to invest upfront in a flexible design system. I used the Ant Design library as a foundation to speed up the creation of our modular component library.
This approach required initial work that didn't look like visible progress, but it was crucial. It ensured visual consistency and allowed engineers to build efficiently. The same core components could be arranged into different dashboards for each role, saving immense time later in the process.
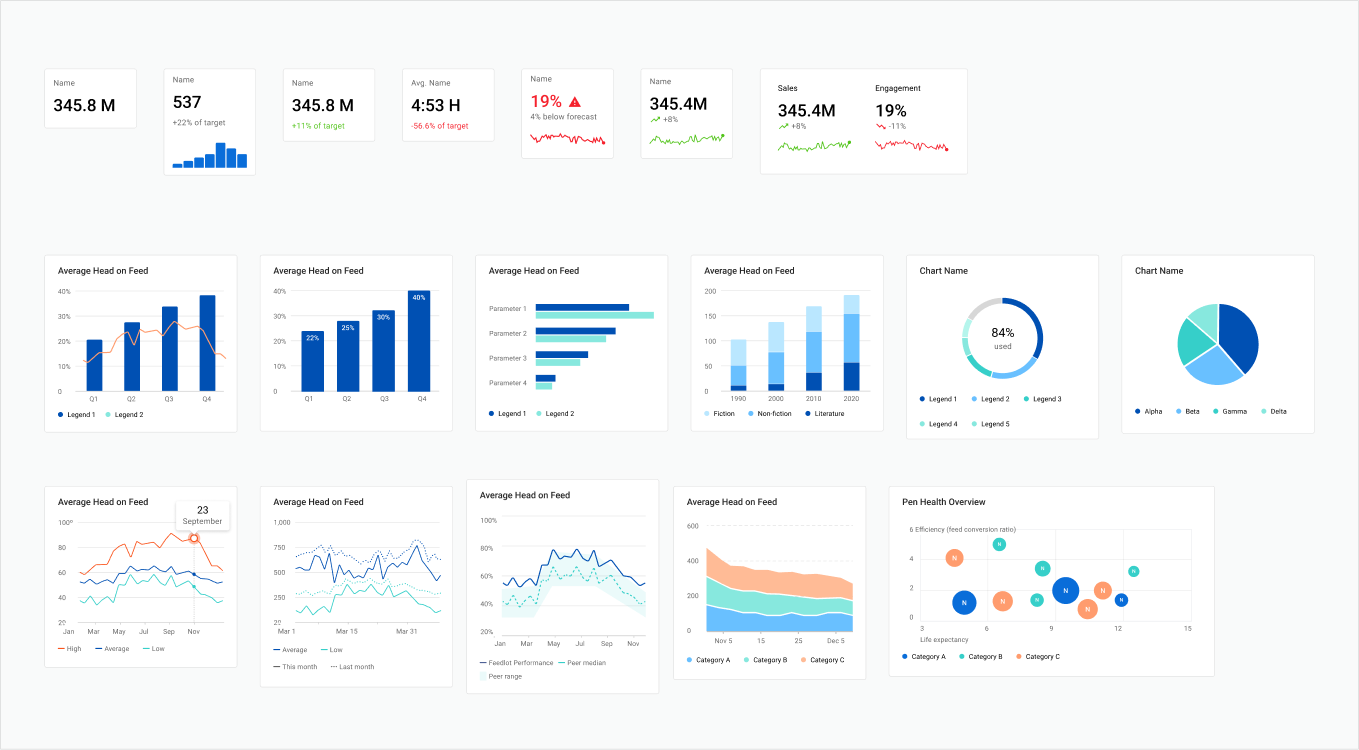
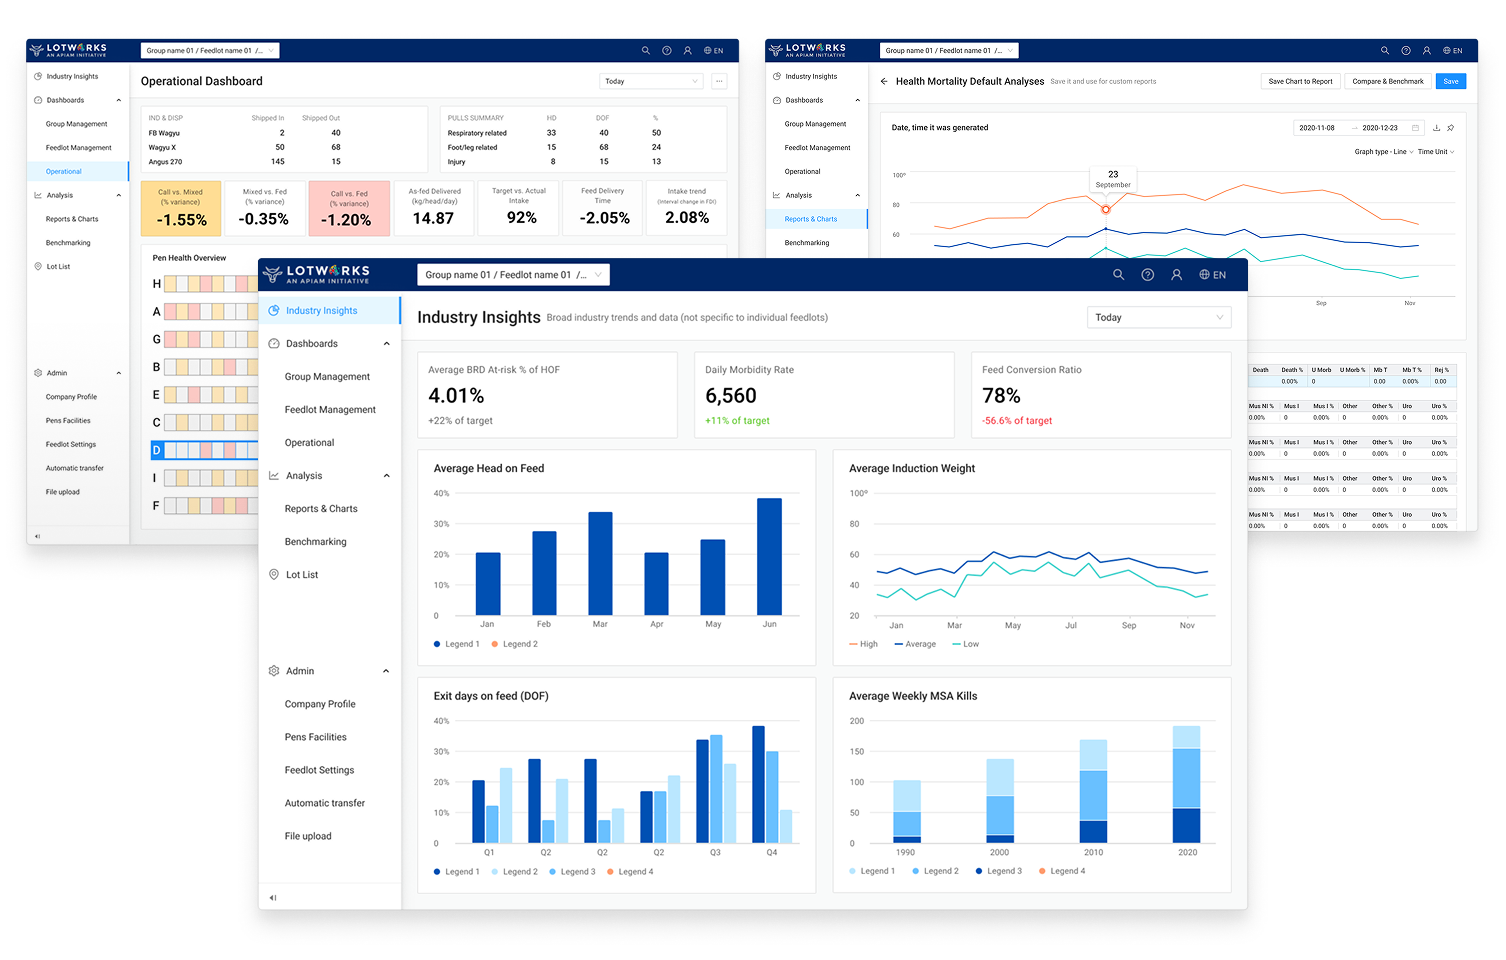
The Platform We Shipped
We delivered a unified system built around three core tools that served every role.
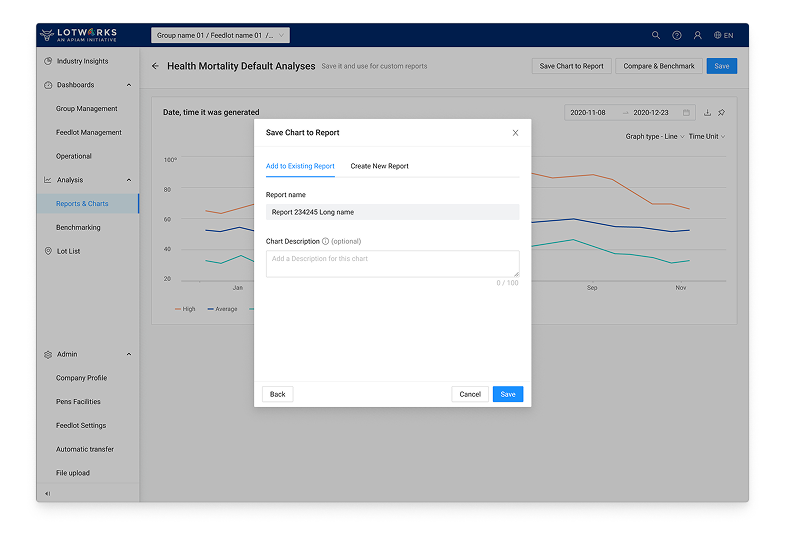
Custom Reporting Engine where users select metrics, choose visualizations, and save their own report templates. This created a flexible analysis tool instead of a library of static reports.
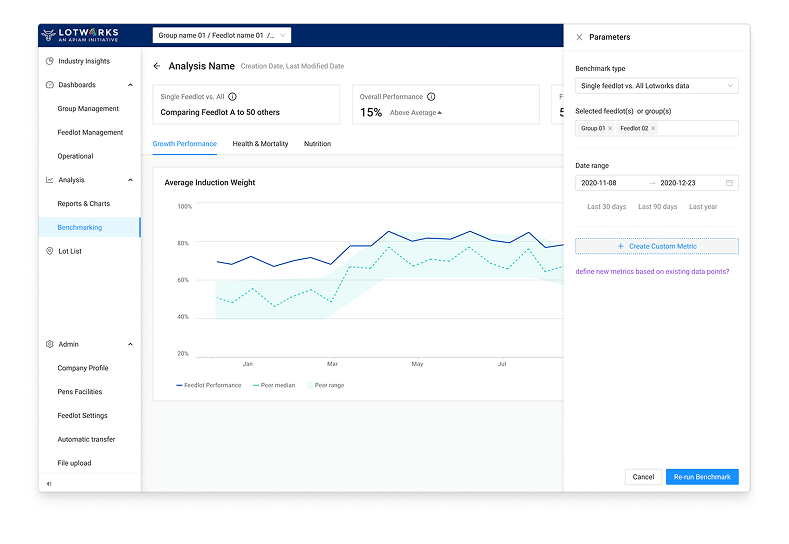
Confidential Benchmarking where feedlots securely compare their performance against industry averages or any other operation, showing them their competitive standing.
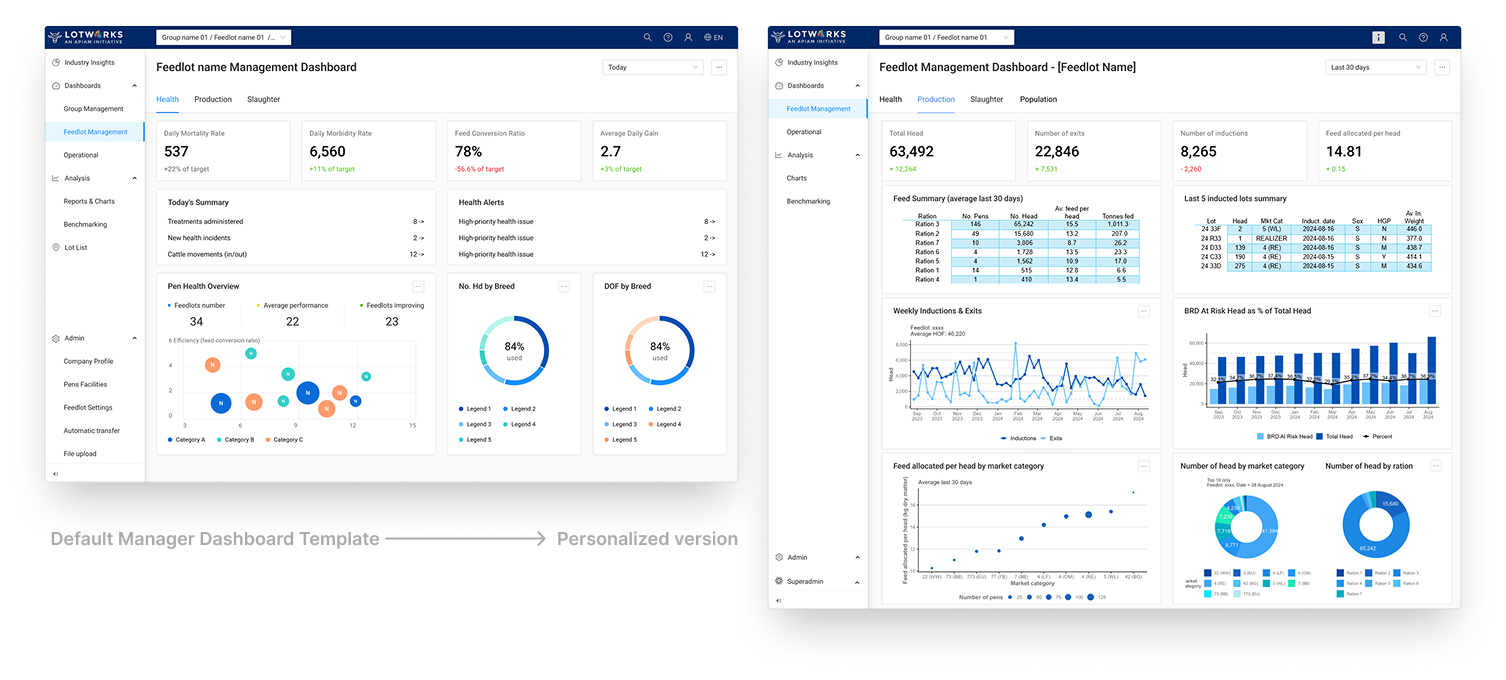
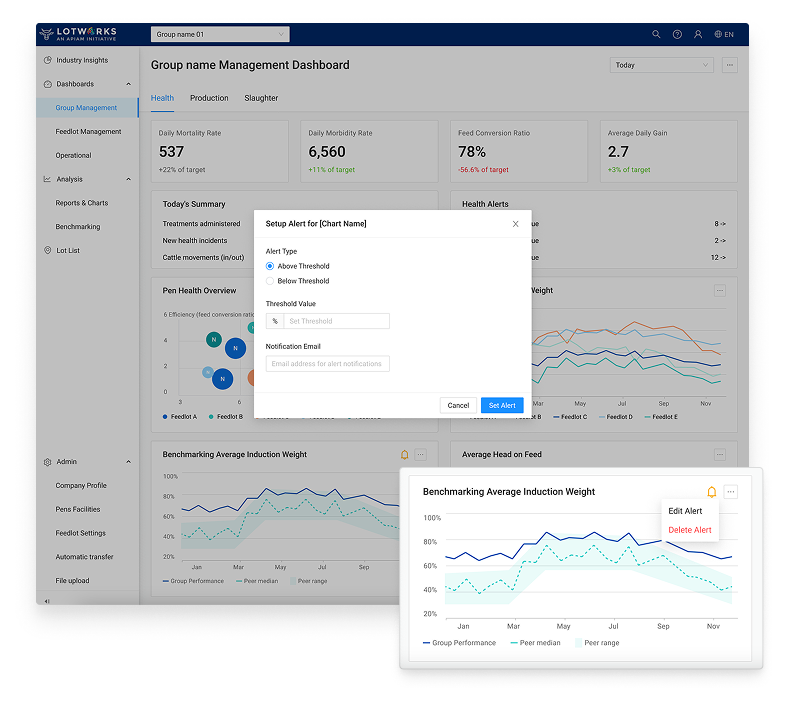
Personalized Workspace where dashboards start with smart defaults for each role but can be changed and personalized endlessly.
Intelligent Alert System where alerts are based on trends, deviations, and custom logic defined by consultants, moving far beyond basic threshold notifications.
The Results
Four months in, the project moved from a confusing feature list to a complete blueprint for a complex enterprise platform.
Business outcomes
Saved clients worth $2M+ annually. Every pilot converted to paid.
User outcomes
Cut consultant monitoring time from 2 hours to 15 minutes daily. 92% of users customized dashboards in the first week, proving they understood the system.
System outcomes
One design system now serves 4 completely different workflows. New features ship without rebuilding core architecture.
With More Time
The biggest constraint was the timeline. With just eleven weeks to design four distinct experiences, I focused AI capabilities on the Manager dashboard where the business case was clearest and the risk was highest.
Given more time, I would have extended AI into the reporting engine and benchmarking tool. Both systems generate insights from historical data, which creates natural opportunities for predictive modeling. The reporting engine could suggest which metrics matter most based on current conditions. The benchmarking tool could predict performance gaps before they widen.
These weren't technical limitations. They were prioritization decisions made under pressure. The foundation is there. The next phase would be expanding AI from operational alerts into strategic planning tools.
"Anna was a lifesaver. As well as being a talented and knowledgeable designer, no challenge was too much for Anna to tackle and her results were always of the highest quality. An excellent and timely communicator, Anna was efficient and delivered outputs that went above and beyond the requirements. Her work always represented a significant value-add. I cannot recommend Anna highly enough if you want timely interface design delivered to an excellent quality."

Dr Jaimie Hunnam BSc BVSc MVSc MANZCVS (Epi) MBA PhD
Senior Consultant
Ausvet Pty Ltd